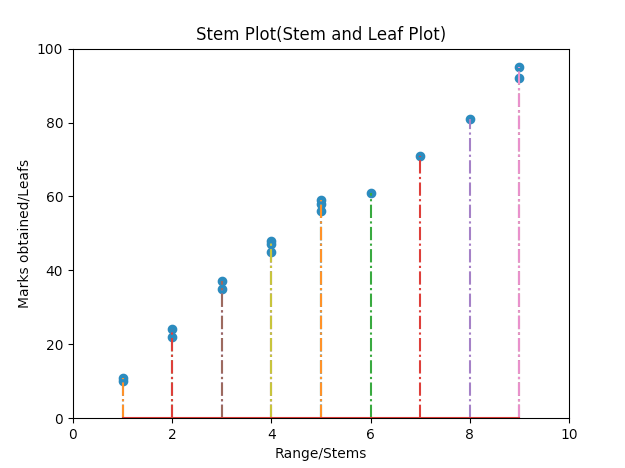
Overview:
- Stem plot is a popular statistical tool that helps in exploratory data analysis.
- A stem plot separates the digits in data points to form two columns.
- Python Matplotlib draws a stem plot as a set of Y values plotted against common X-axis values.
- The higher valued digit forms the left column – called stem.
- The lower valued digit forms the values in the right column – called leafs.
- The data is ordered in a stem plot.
- The stems are from low value to higher values and so are the leafs.
- The first leaf of the first stem forms the lowest value of the distribution.
- The last leaf of the last stem forms the highest value of the distribution.
Why to use Stem Plots?
- A stem plot helps visualizing the shape of the distribution.
- Unlike the other graphic methods, stem plots retain their data value from the raw data to at least two digits.
How to construct a Stem plot manually:
- Creating stems: Order the data points. Plot only the left hand side digit of the data points and enter only once as a first column. Stems can be reused as well to form finer data ranges.
- Creating Leafs: On each data point the second digit should be placed one after another separated as commas as second column against the corresponding the stem.
Plotting a Stem Plot using Python:
- The stem() function of the pyplot module is called with data for stems followed by the data for leafs i.e, X data followed by y data
Example:
|
import matplotlib.pyplot as plot import numpy as np import pylab
# marks obtained by students in an examination marks = [10,11,22,24,35,37,45,47,48,58,56,59,61,71,81,92,95]
# corresponding stems stems = [1,1,2,2,3,3,4,4,4,5,5,5,6,7,8,9,9]
# set the x axis and y axis limits pylab.xlim([0,10]) pylab.ylim([0,100])
# Provide a title for the stem plot plot.title('Stem Plot(Stem and Leaf Plot)')
# Give x axis label for the stem plot plot.xlabel('Range/Stems')
# Give y axis label for the stem plot plot.ylabel('Marks obtained/Leafs')
# plot the stem plot using matplotlib markerline, stemlines, baseline = plot.stem(stems, marks, '-.')
# display the stem plot plot.show() |
Output:
